Direct Problem Solver
odatse-STR module provides a wrapper to the forward problem solvers of ODAT-SE for the program sim-trhepd-rheed , which calculates the intensity of reflection fast (positron) electron diffraction (RHEED, TRHEPD) (A. Ichimiya, Jpn. J. Appl. Phys. 22, 176 (1983); 24, 1365 (1985)). In this tutorial, we will present several examples of analyses using algorithms with sim-trhepd-rheed. First, we will explain how to install and test sim-trhepd-rheed. For details, see the official web page for sim-trhepd-rheed.
Download and Install
First, you need to obtain the source files from the repository, and move to the directory of odatse-STR module.
$ git clone https://github.com/2DMAT/odatse-STR.git
$ cd odatse-STR
Next, you need to download the source files of sim-trhepd-rheed from their repository, and build it.
$ git clone https://github.com/sim-trhepd-rheed/sim-trhepd-rheed
$ cd sim-trhepd-rheed/src
$ make
Makefile should be modified according to your environment.
When it is successful, bulk.exe and surf.exe will be created.
Calculation execution
In sim-trhepd-rheed, the bulk part of the surface structure is first calculated with bulk.exe.
Then, using the results of the bulk.exe calculation (the bulkP.b file), the surface portion of the surf.exe surface structure is calculated.
In this tutorial, we will actually do the TRHEPD calculation.
The sample input files are located in sample/solver of odatse-STR.
First, copy this folder to a suitable working folder work.
$ cp -r sample/solver work
$ cd work
Next, copy bulk.exe and surf.exe to work.
$ cp ../sim-trhepd-rheed/src/bulk.exe .
$ cp ../sim-trhepd-rheed/src/surf.exe .
Execute bulk.exe.
$ ./bulk.exe
Then, the bulk file bulkP.b will be generated.
$ ls
bulk.exe bulk.txt bulkP.b surf.exe surf.txt
Next, execute surf.exe.
$ ./surf.exe
After the execution, the files surf-bulkP.md, surf-bulkP.s and SURFYYYYMMDD-HHMMSSlog.txt will be generated. (YYYYMMDD and HHMMSS stand for the execution date and time, respectively.)
Visualization of calculation result
The contents of surf-bulkP.s are shown as follow:
#azimuths,g-angles,beams
1 56 13
#ih,ik
deg,6 0,5 0,4 0,3 0,2 0,1 0,0 0,-1 0,-2 0,-3 0,-4 0,-5 0,-6 0,
  5.0000E-01,  0.0000E+00,  0.0000E+00,  0.0000E+00,  0.0000E+00,  0.0000E+00,  0.0000E+00,  1.5946E-02,  0.0000E+00,  0.0000E+00,  0.0000E+00,  0.0000E+00,  0.0000E+00,  0.0000E+00,
  6.0000E-01,  0.0000E+00,  0.0000E+00,  0.0000E+00,  0.0000E+00,  0.0000E+00,  0.0000E+00,  1.8701E-02,  0.0000E+00,  0.0000E+00,  0.0000E+00,  0.0000E+00,  0.0000E+00,  0.0000E+00,
  7.0000E-01,  0.0000E+00,  0.0000E+00,  0.0000E+00,  0.0000E+00,  0.0000E+00,  0.0000E+00,  2.1202E-02,  0.0000E+00,  0.0000E+00,  0.0000E+00,  0.0000E+00,  0.0000E+00,  0.0000E+00,
  8.0000E-01,  0.0000E+00,  0.0000E+00,  0.0000E+00,  0.0000E+00,  0.0000E+00,  2.1711E-03,  1.9273E-02,  2.1711E-03,  0.0000E+00,  0.0000E+00,  0.0000E+00,  0.0000E+00,  0.0000E+00,
  9.0000E-01,  0.0000E+00,  0.0000E+00,  0.0000E+00,  0.0000E+00,  0.0000E+00,  4.3965E-03,  1.7006E-02,  4.3965E-03,  0.0000E+00,  0.0000E+00,  0.0000E+00,  0.0000E+00,  0.0000E+00,
  1.0000E+00,  0.0000E+00,  0.0000E+00,  0.0000E+00,  0.0000E+00,  0.0000E+00,  6.3263E-03,  1.4952E-02,  6.3263E-03,  0.0000E+00,  0.0000E+00,  0.0000E+00,  0.0000E+00,  0.0000E+00,
...
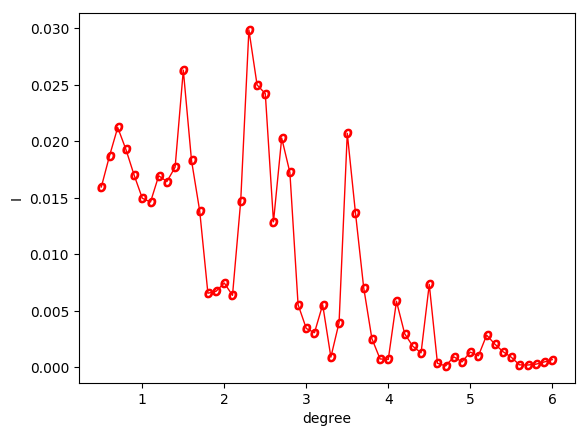
From the above file, a rocking curve is created whose horizontal axis is the angle (first column of data after row 5) and the vertical axis shows the intensity of the (0,0) peak (eighth column of data after row 5).
You can use Gnuplot or other graphing software, but here we use the program plot_bulkP.py in the script folder.
Run it as follows.
$ python3 ../script/plot_bulkP.py
Then, plot_bulkP.png will be created as follows.

Fig. 1 Rocking curve of Si(001)-2x1 surface.
We will make convolution and normalization to these diffraction intensity data of the 00 peaks.
Prepare surf-bulkP.s and run make_convolution.py.
$ python3 ../script/make_convolution.py
When executed, the following file convolution.txt will be created.
0.500000 0.010818010
0.600000 0.013986716
0.700000 0.016119093
0.800000 0.017039022
0.900000 0.017084666
  ... skipped ...
5.600000 0.000728539
5.700000 0.000530758
5.800000 0.000412908
5.900000 0.000341740
6.000000 0.000277553
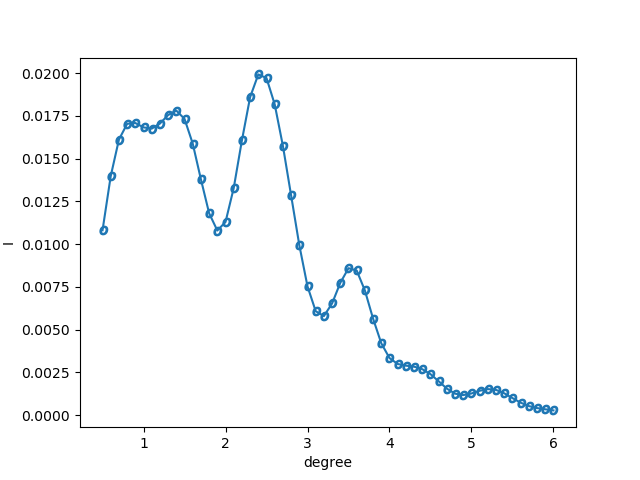
The first column is the viewing angle, and the second column is the normalized 00-peak diffraction intensity data written in surf-bulkP.s with a convolution of half-width 0.5.
By using plot_convolution.py, a figure plot_convolution.png will be generated as follows.
$ python3 ../script/plot_convolution.py

Fig. 2 Rocking curve of Si(001)-2x1 surface that is made convolution of half-width 0.5 and normalized.